
PaperBanana: Making Academic Illustrations Simple
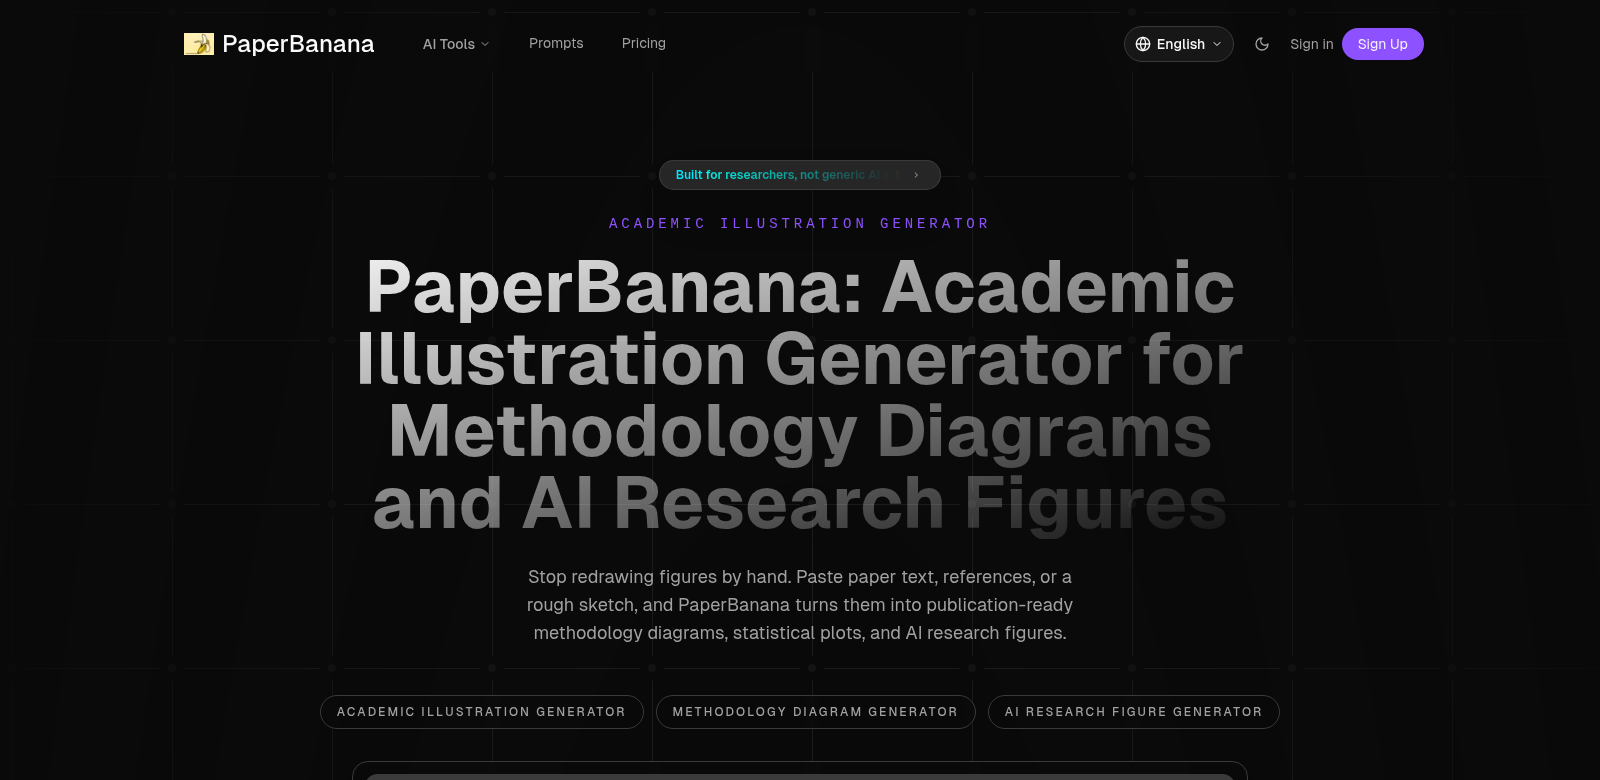
PaperBanana is an AI-powered tool that takes your messy research text, references, and even rough sketches, and turns them into polished methodology diagrams, statistical plots, and clear research visuals. We built it to make visualizing your data simple, so researchers and educators can create high-quality images for their papers and presentations without the usual headache. Check it out at PaperBanana.
Who Uses PaperBanana?
Turns out, a lot of different people find PaperBanana useful. Each group has its own reasons, but we've designed PaperBanana to help them all.
-
Graduate Students: Grad students often struggle to make their complex data easy to understand. PaperBanana lets them focus on their actual research, not on wrestling with design software, and still get visuals ready for publication.
-
Researchers: Researchers across all fields use PaperBanana to create clear, informative diagrams for their academic papers. It helps them communicate their findings better in peer-reviewed journals.
-
Academics and Professors: Academics and professors need good visuals for lectures and articles. PaperBanana helps them produce polished images, making their teaching materials and publications look sharp.
-
Data Analysts: Data analysts love how PaperBanana turns complex datasets into easy-to-understand plots and diagrams. This makes their presentations and discussions much clearer.
-
Publishers and Editors: For publishers and editors, high-quality visuals are crucial. PaperBanana simplifies getting images that actually meet publication standards.
The Problems PaperBanana Solves
Let's face it, making academic illustrations can be a real pain. PaperBanana was built to tackle those headaches head-on.
Problems We Found
-
Complexity in Creating Visuals: It's hard to create diagrams that truly show what your data means, which often leads to confusion.
-
Time Consuming Processes: Making detailed visuals the old way takes forever, pulling researchers away from their actual work.
-
Quality Standards: Academic journals have tough rules for images, and basic design tools just don't cut it.
-
Accessibility Issues: If visuals aren't designed well, they just confuse readers.
-
Collaboration Barriers: When working with others, getting everyone on the same page for visual styles can be a nightmare.
PaperBanana's Solution
PaperBanana tackles these problems head-on with smart features and an interface that just makes sense. We don't just simplify making great visuals; we make sure they hit all those tough publication standards. Just feed it your text, references, or even a quick sketch, and PaperBanana turns it into a polished diagram. That means researchers can stop fiddling with design and get back to their actual work. Plus, our automatic formatting means every visual looks top-notch and exactly what academics expect.
Real-World Uses
Here are a few ways people actually use PaperBanana:
- A grad student can sketch out their methodology, feed it to PaperBanana, and get a polished diagram ready for their thesis.
- A data analyst with a pile of complex data can use PaperBanana to create a visual that untangles statistical relationships, making team meetings much clearer when explaining findings.
- Academics use PaperBanana to create presentation illustrations, making sure everything looks consistent and meets their university's or publisher's standards.
Top Features of PaperBanana
PaperBanana comes packed with features designed to make your life easier and your visuals better.
-
AI-Powered Visualization. It automatically turns your text and sketches into polished diagrams, saving researchers a ton of time.
-
Publication-Ready Outputs. Your visuals will meet academic publishing standards, guaranteeing quality and consistency.
-
User-Friendly Interface. We've made creating complex diagrams simple, so anyone can use it, no matter their design skill.
-
Customizable Templates. Pick from a range of templates built for different research fields, making your visuals look great.
-
Collaborative Tools. Work better with co-authors thanks to easy sharing and editing of visuals.
Common Questions About PaperBanana
-
What can I create using PaperBanana? You can create methodology diagrams, statistical plots, and all sorts of research visuals that make your data shine.
-
Is the tool suitable for all academic disciplines? Yep, it's flexible enough for almost any academic field. Everyone can make visuals that fit their specific research.
-
How user-friendly is the interface? We designed the interface to be super simple. Even if you've never touched design software, you can create complex visuals without breaking a sweat.
-
Can I collaborate with others? Yes! PaperBanana has built-in collaboration tools, so multiple people can easily work on and revise visuals together.
-
What makes PaperBanana different from traditional graphic design tools? Traditional design software isn't built for academics. PaperBanana is. It has features that save you time and make sure your visuals meet all those academic standards.